Mathematica: Visualizing Probability Distributions
« Back to notesI put this together to help illustrate some concepts behind probability for my sister. Copy and paste it into Mathematica and you’ll get a handy interactive pair of probability distributions.
Manipulate[
 Histogram[
  {
   RandomReal[NormalDistribution[\[Mu]1, \[Sigma]1], n1],
   RandomReal[NormalDistribution[\[Mu]2, \[Sigma]2], n2]
   }, {-10, 10, .5}
  ],
 {\[Mu]1, -5, 5, Appearance -> "Labeled"},
 {\[Sigma]1, 1, 5, Appearance -> "Labeled"},
 {n1, 25, 1000, Appearance -> "Labeled"},
 {\[Mu]2, -5, 5, Appearance -> "Labeled"},
 {\[Sigma]2, 1, 5, Appearance -> "Labeled"},
 {n2, 25, 1000, Appearance -> "Labeled"}
 ]
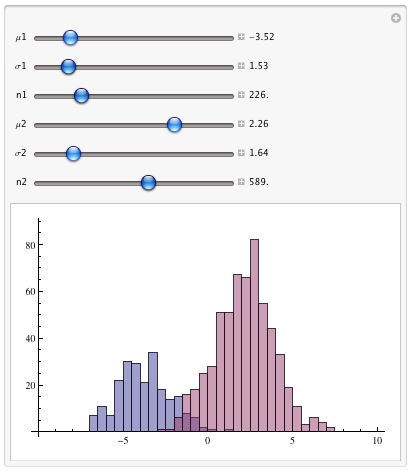
It should look like this:
« Back to notes